Investigating Global Trust in Science by Gender, Faith, Politics, and Education
Survey-weighted analysis of trust and attitudes toward science across gender, education, politics, and religiosity
Optional: short clip/screen recording of results (plots, dashboards, or workflow). Poster shows before playback.
Motivation
Public trust in science and healthcare shapes outcomes: people’s medical decisions, responses to public health guidance, and interpretation of uncertainty and risk. I had anecdotal evidence, and personal experience, that women often have worse experiences in the healtchare system due to institutional-level biases. I wanted to see if my instincts were correct, or if perhaps there were some other explanation for this. While there are no recent global open-source datasets that could answer the healthcare question directly, I chose to redirect my quesiton to a general trust in science. While this isn't a perfect proxy, it would still tell me a lot about my question. Once I'd done this initial exploration, I wanted to expand it to investigate different stratifications to see how they affected Trust in Science too while being careful about the statistical pitfalls common in large survey datasets.
What I analyzed
The analysis focuses on trust/attitude measures (Likert-style items) and compares distributions across groups, then examines correlations and modeled relationships with key demographic predictors. The goal is not to “win an argument” with a plot, but to produce an interpretable, reproducible workflow that a careful reader could audit.
Core comparisons
- Gender × trust: how trust/attitudes differ by gender
- Education × trust: association between education level and trust measures
- Politics × trust: association between political orientation and trust measures
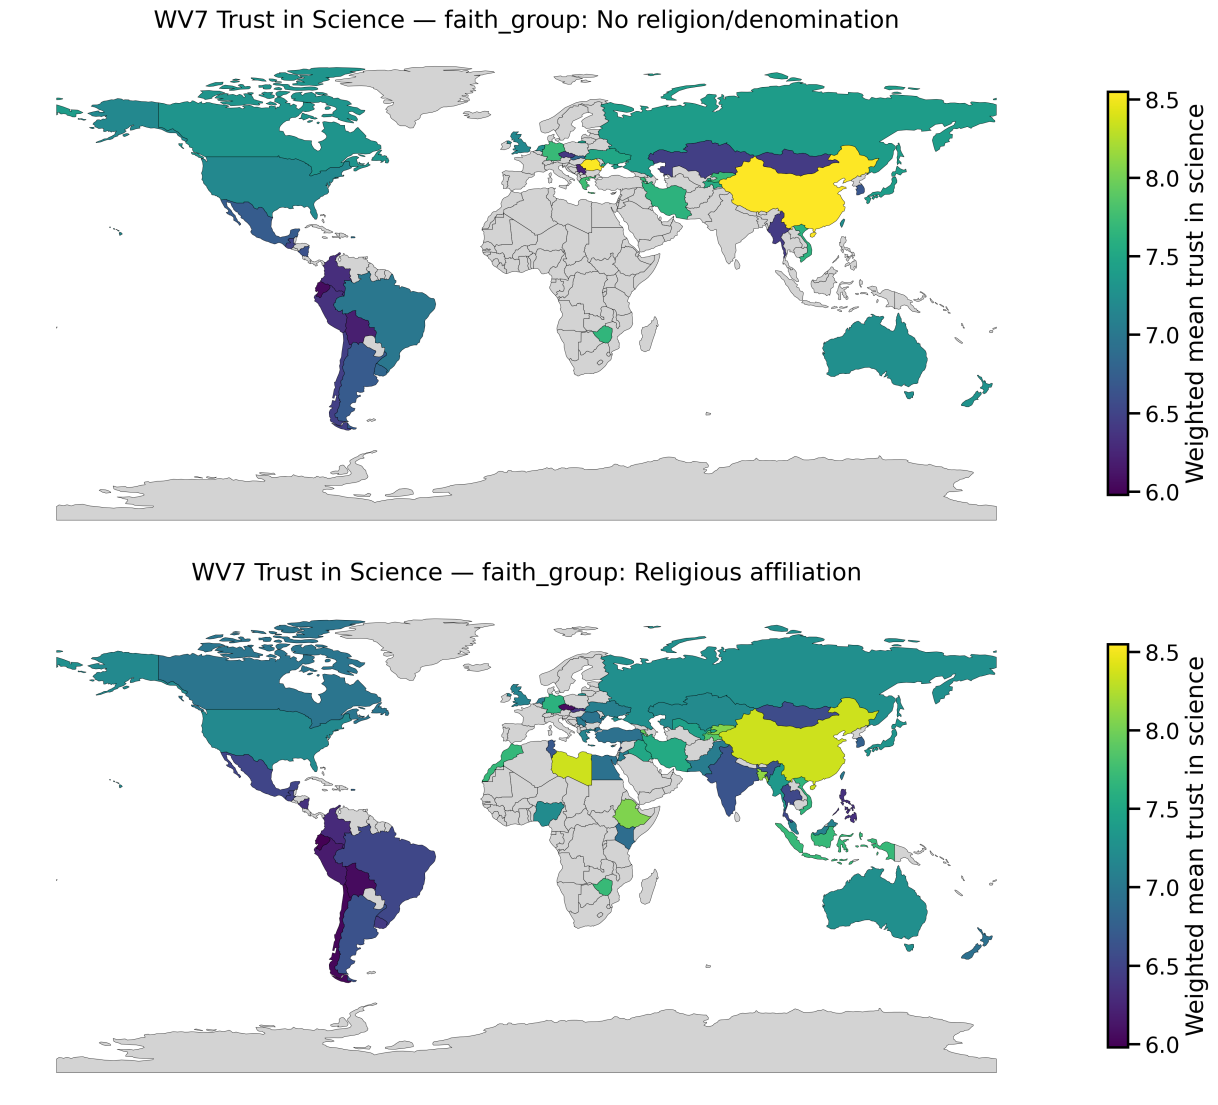
- Religiosity × trust: association between religiosity and trust measures
Methodology
Survey analysis is easy to get wrong. This project treats methodology as a first-class concern: consistent recoding of numeric survey responses, explicit handling of missing values, and the use of survey weights when comparing groups so that summary statistics better represent the target population.
Data preparation
- Converted numeric-coded survey columns safely (coercing non-responses to missing)
- Reverse-coded negatively worded items to keep interpretation consistent
- Kept analysis scoped to interpretable comparisons rather than overfitting
Analysis & reporting
- Used weights for group summaries where appropriate
- Focused on effect sizes and directionality, not just “significance”
- Designed plots to be readable and honest about uncertainty
Challenges & debugging
A recurring practical challenge in survey analysis is reshaping and aggregating data cleanly when columns contain mixed types or duplicated labels, and when missingness is encoded inconsistently across variables. Debugging involved making transformations explicit and validating intermediate outputs (counts, distributions, and spot-checks) before producing plots.
Global Patterns in Trust in Science
These maps show weighted national mean trust in science from World Values Survey Wave 7, stratified by religiosity, gender, political orientation, and education. The goal here is to surface where trust differs systematically across groups, which matters directly for public health messaging and healthcare decision-making.
 Click to expand
 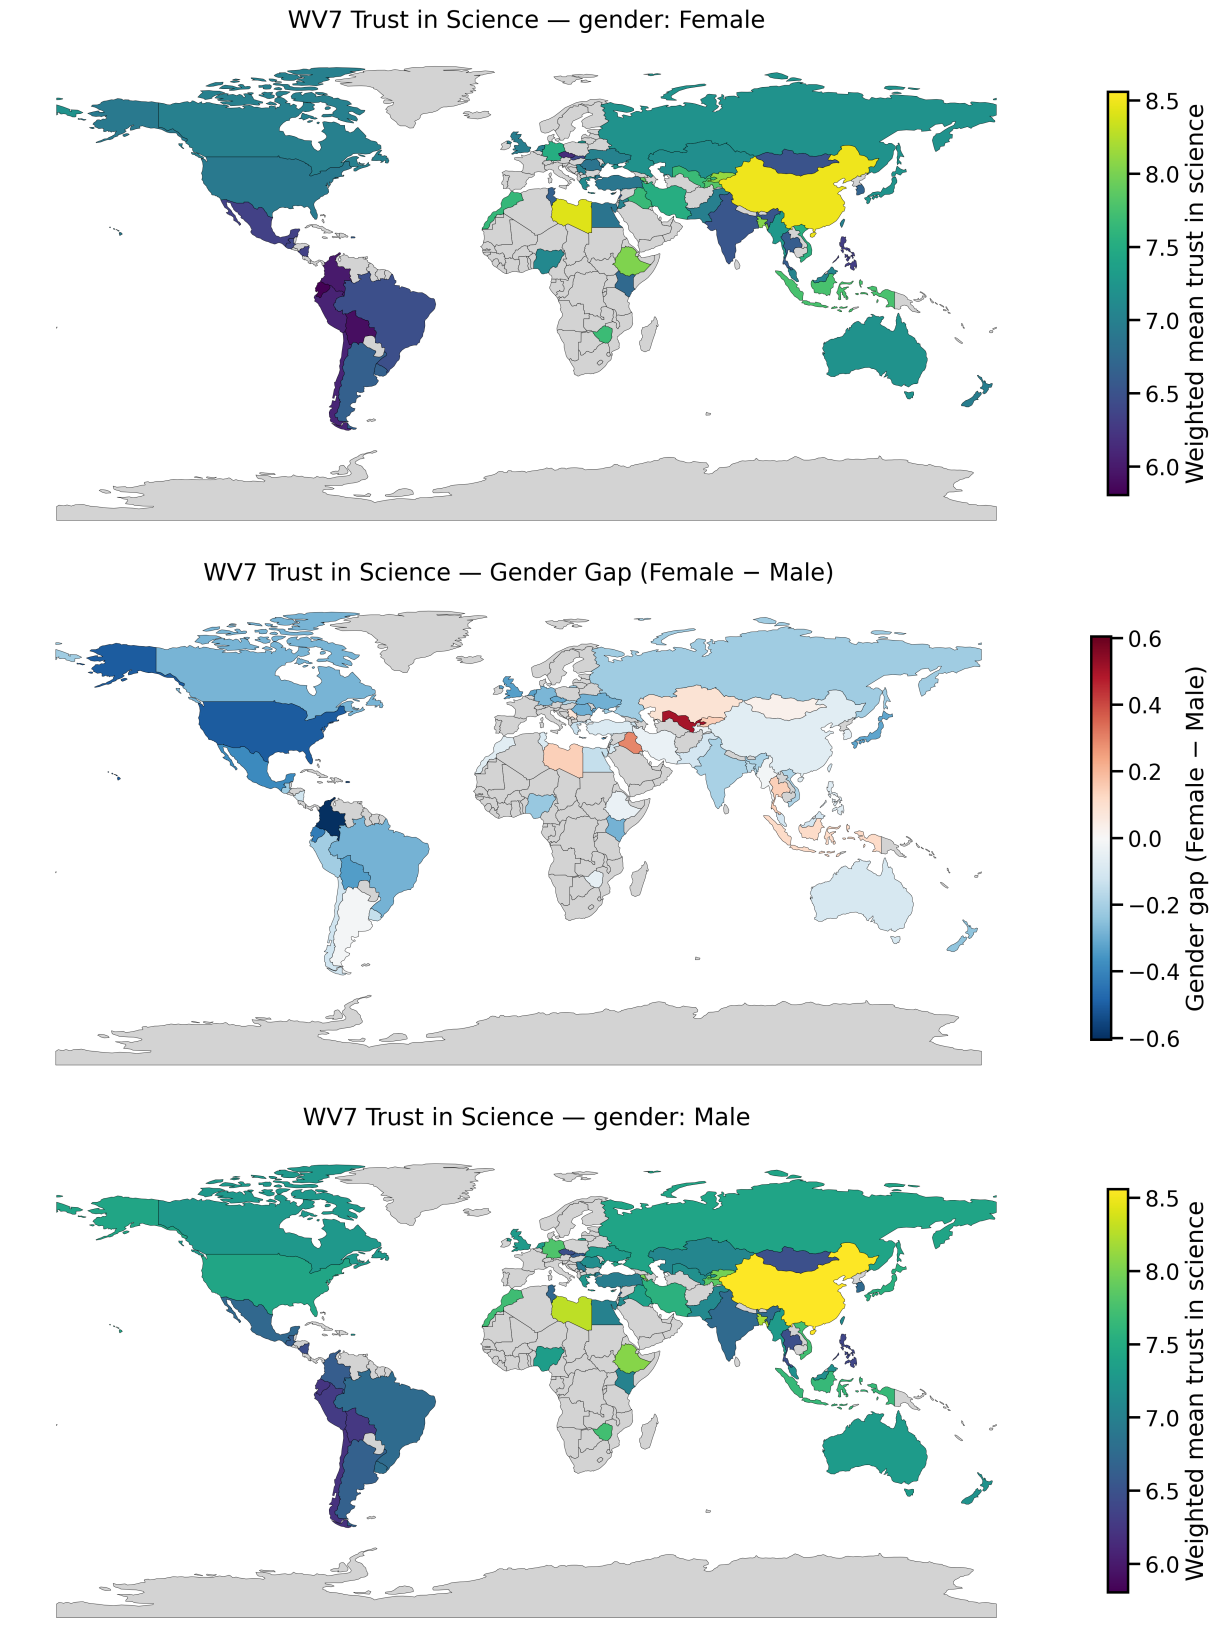 Click to expand
 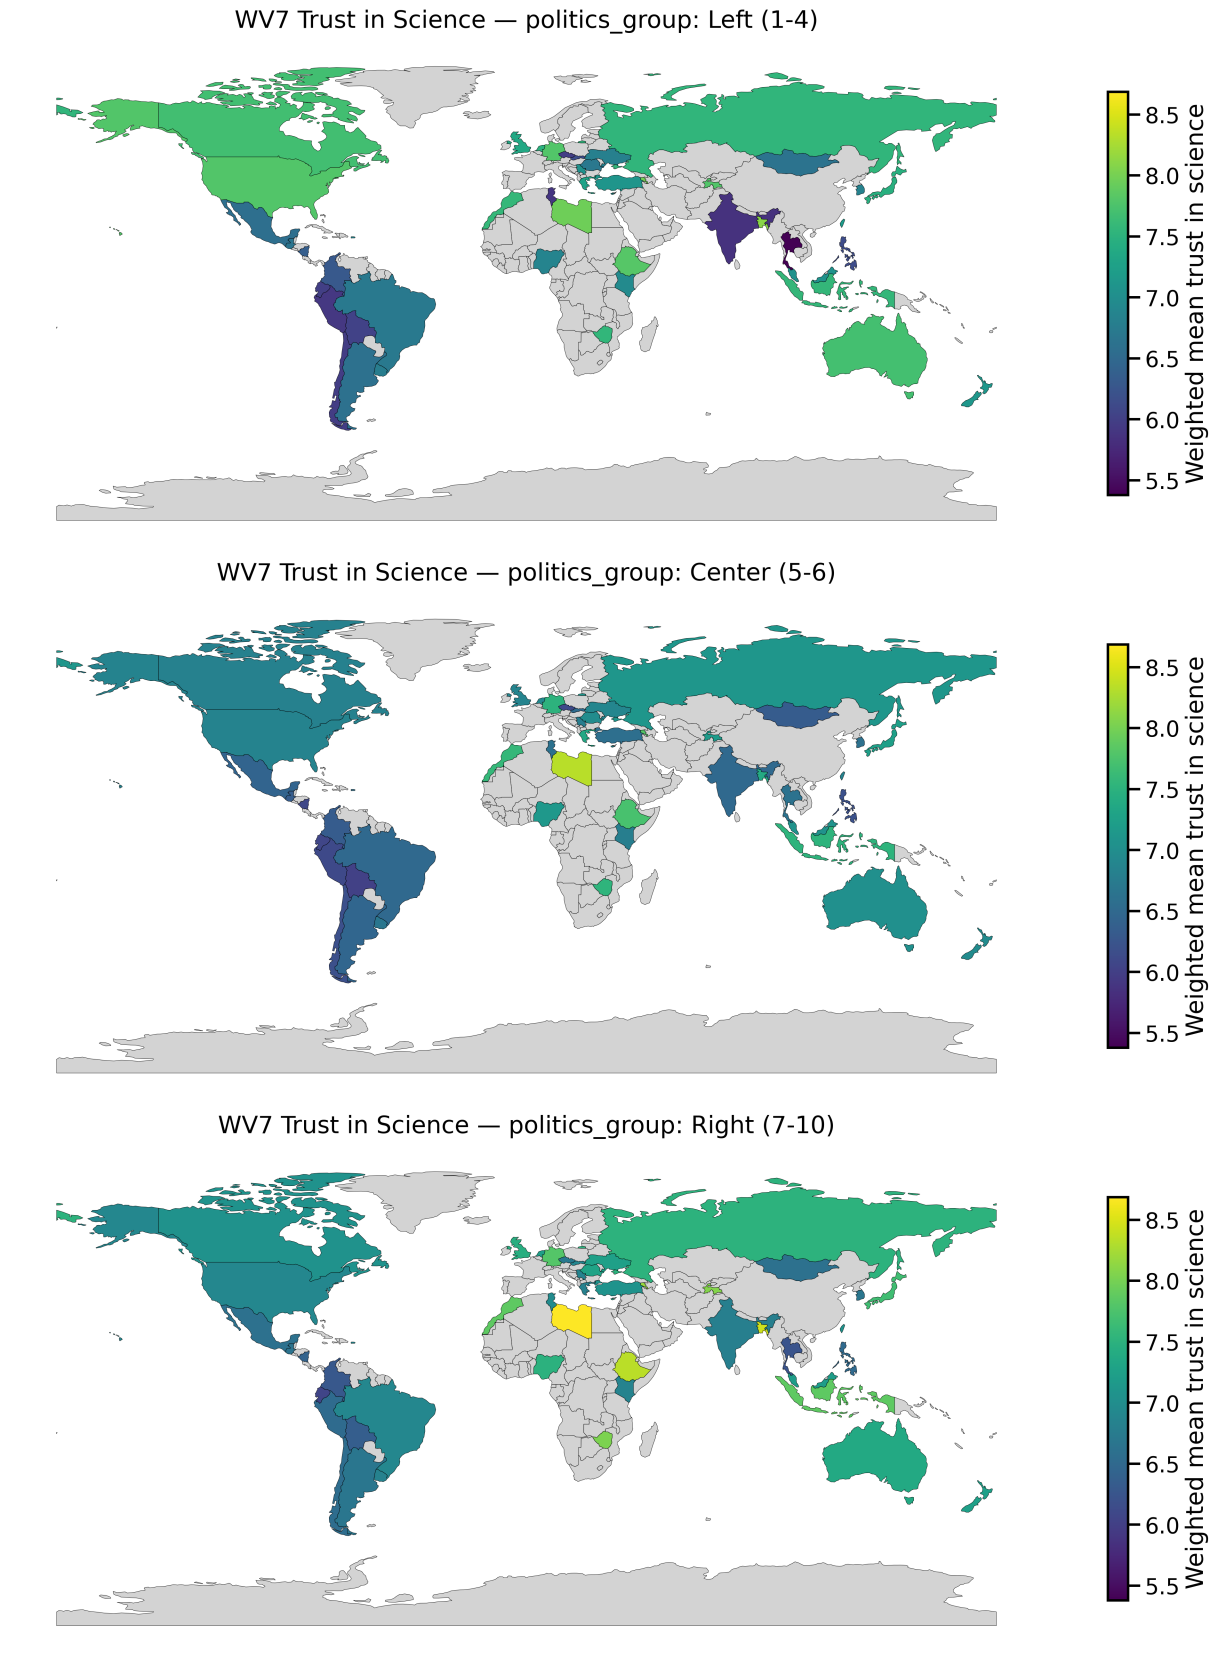 Click to expand
 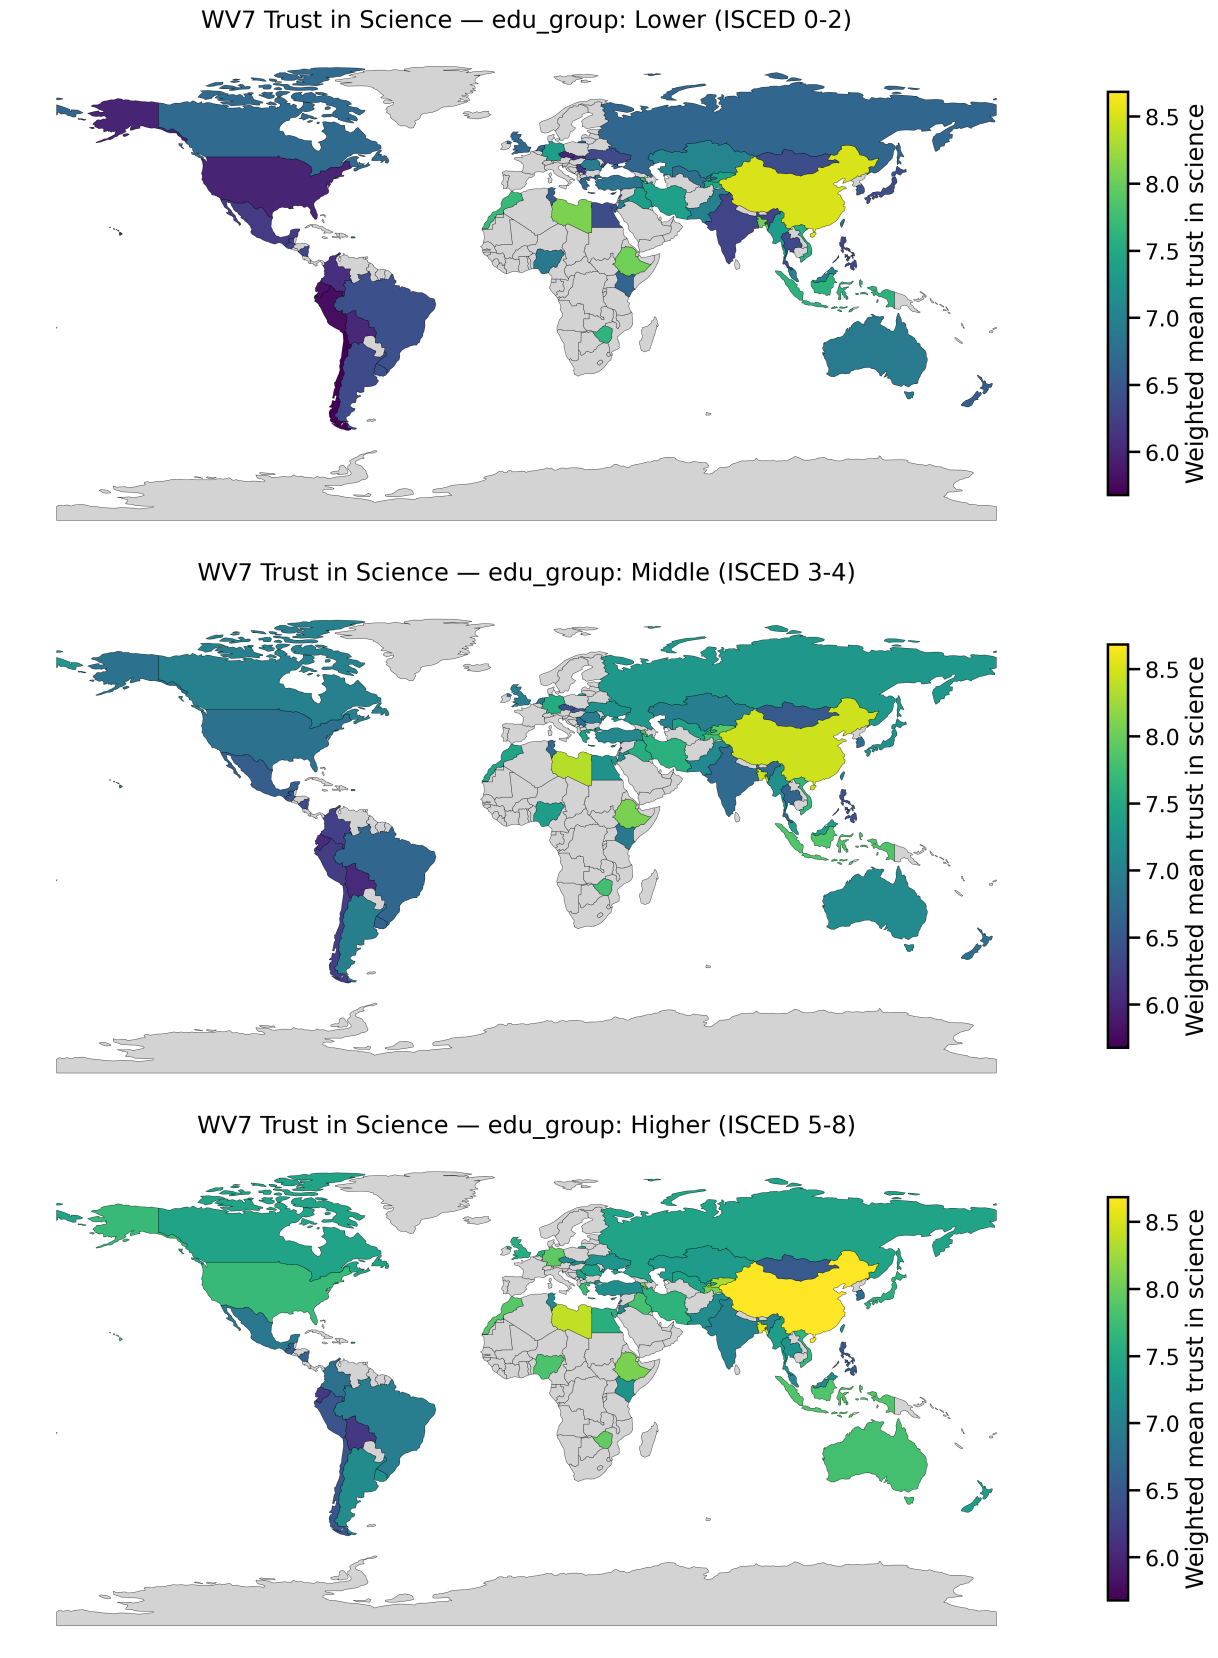 Click to expand
 What this means for public health & science communication
Trust in science shapes health behaviour. It affects whether people accept vaccines, adhere to public health guidance, seek preventative care, and believe medical advice when it conflicts with social or political identity. What these results highlight is that “trust” is not distributed evenly across populations: it can vary by education, ideology, and religiosity, and those differences can look very different depending on country context.
From a public health perspective, the takeaway is that communication strategies shouldn’t assume a one-size-fits-all audience. When trust is lower in specific groups, simply increasing the volume of messaging often backfires. A better approach is targeted, trust-aware communication: working through credible messengers, addressing local concerns directly, and measuring outcomes (not just reach).
Policy / healthcare takeaway
- Risk communication: tailor messaging to how different communities weigh uncertainty and authority.
- Clinical context: trust influences adherence—especially for preventative care and chronic disease management.
- Equity lens: gaps in trust can compound inequities if public health messaging misses specific groups.
Methodological takeaway
- Stratification matters: group averages can hide meaningful within-country differences.
- Weights matter: population-weighted estimates can shift interpretations substantially.
- Comparability matters: country-by-country context is essential before making causal claims.
This project is intentionally framed as a careful descriptive analysis: it identifies where trust differs and suggests why this matters for healthcare systems and public messaging, while avoiding overclaiming causality.
What this demonstrates
This project demonstrates end-to-end data analysis skills on messy, real-world data: defining a scope, cleaning and recoding, choosing methods that match the data-generating process (including weighting), and communicating results in a way that avoids overclaiming. These skills transfer directly to product analytics, applied research, policy-facing data work, and R&D teams working with observational datasets.